Monitoring
OpenTelemetry is an open-source observability framework providing APIs and instrumentation for generating, collecting, processing, and exporting telemetry data, such as traces, metrics, and logs. Its flexible design supports a wide range of backends and seamlessly integrates with modern application tools.
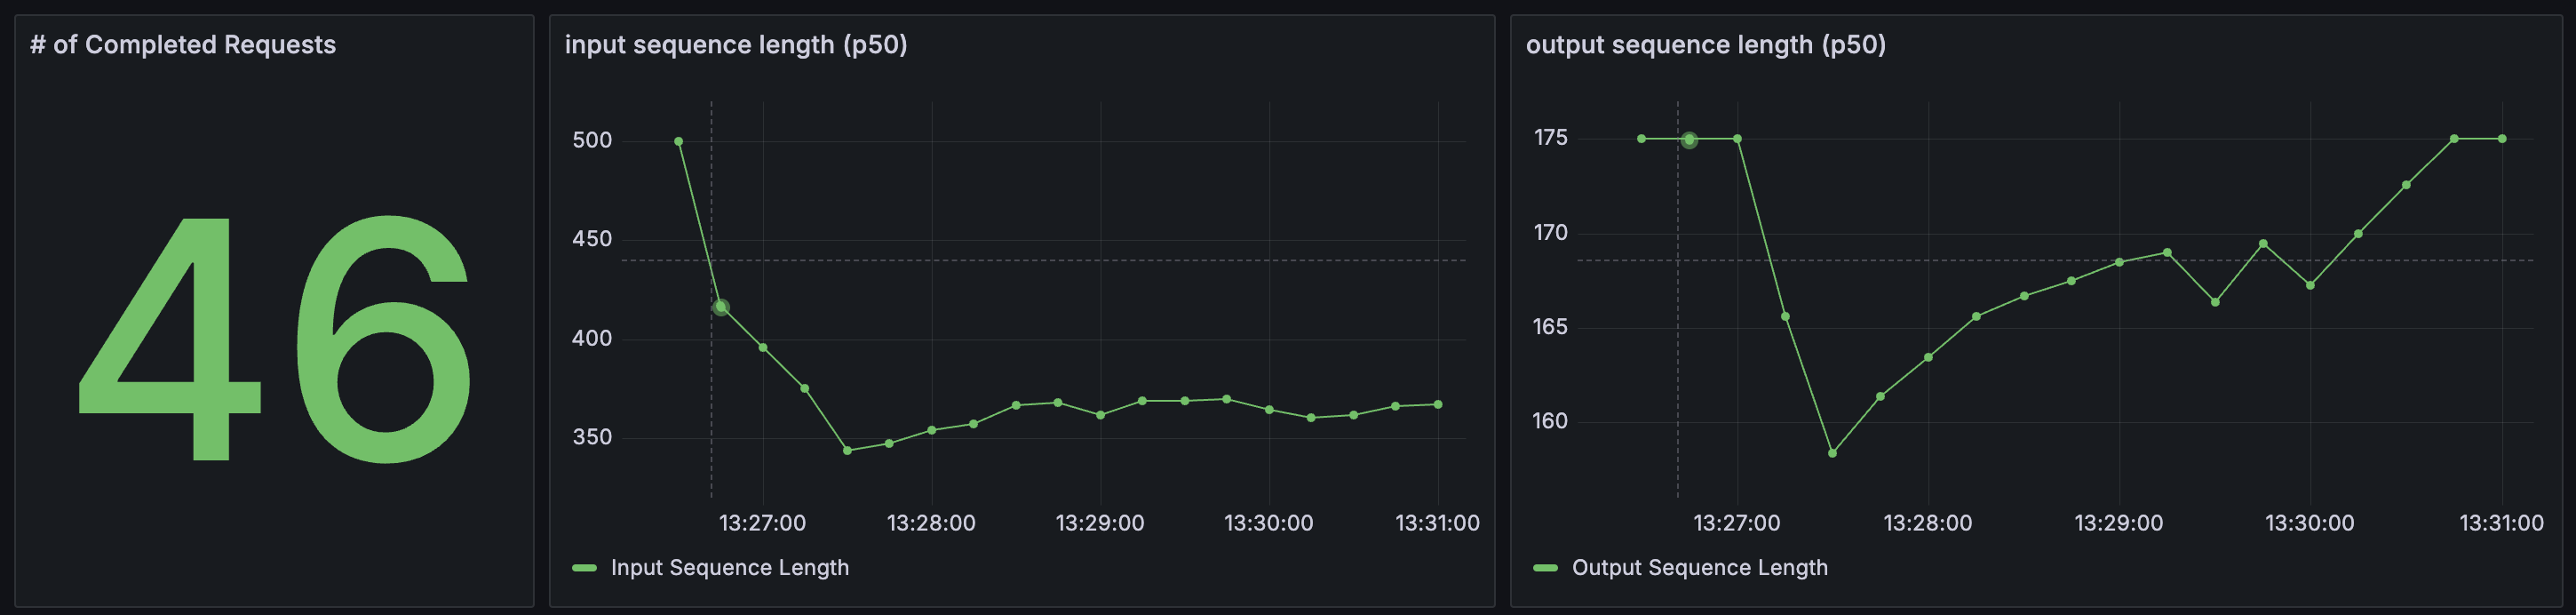
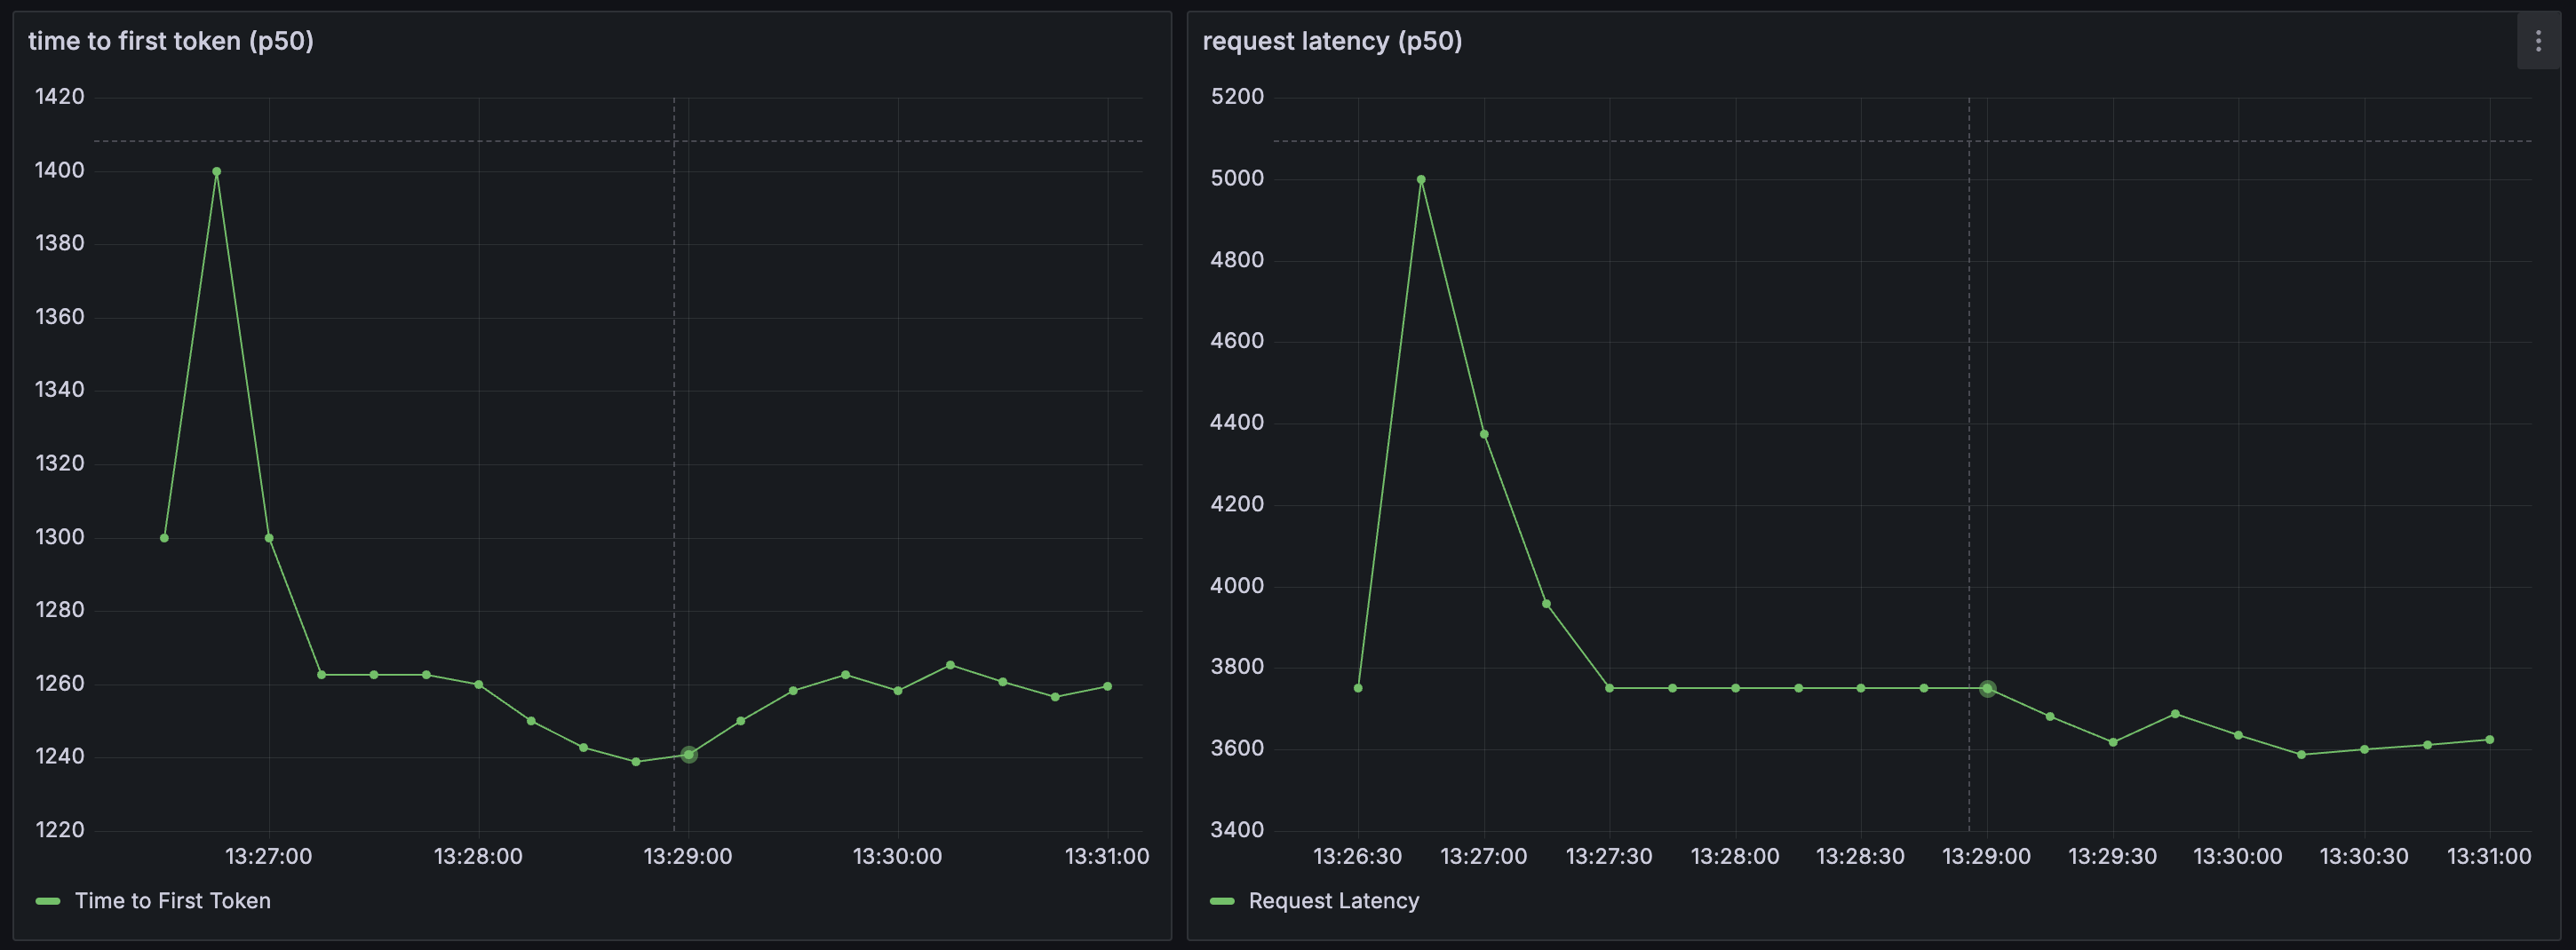
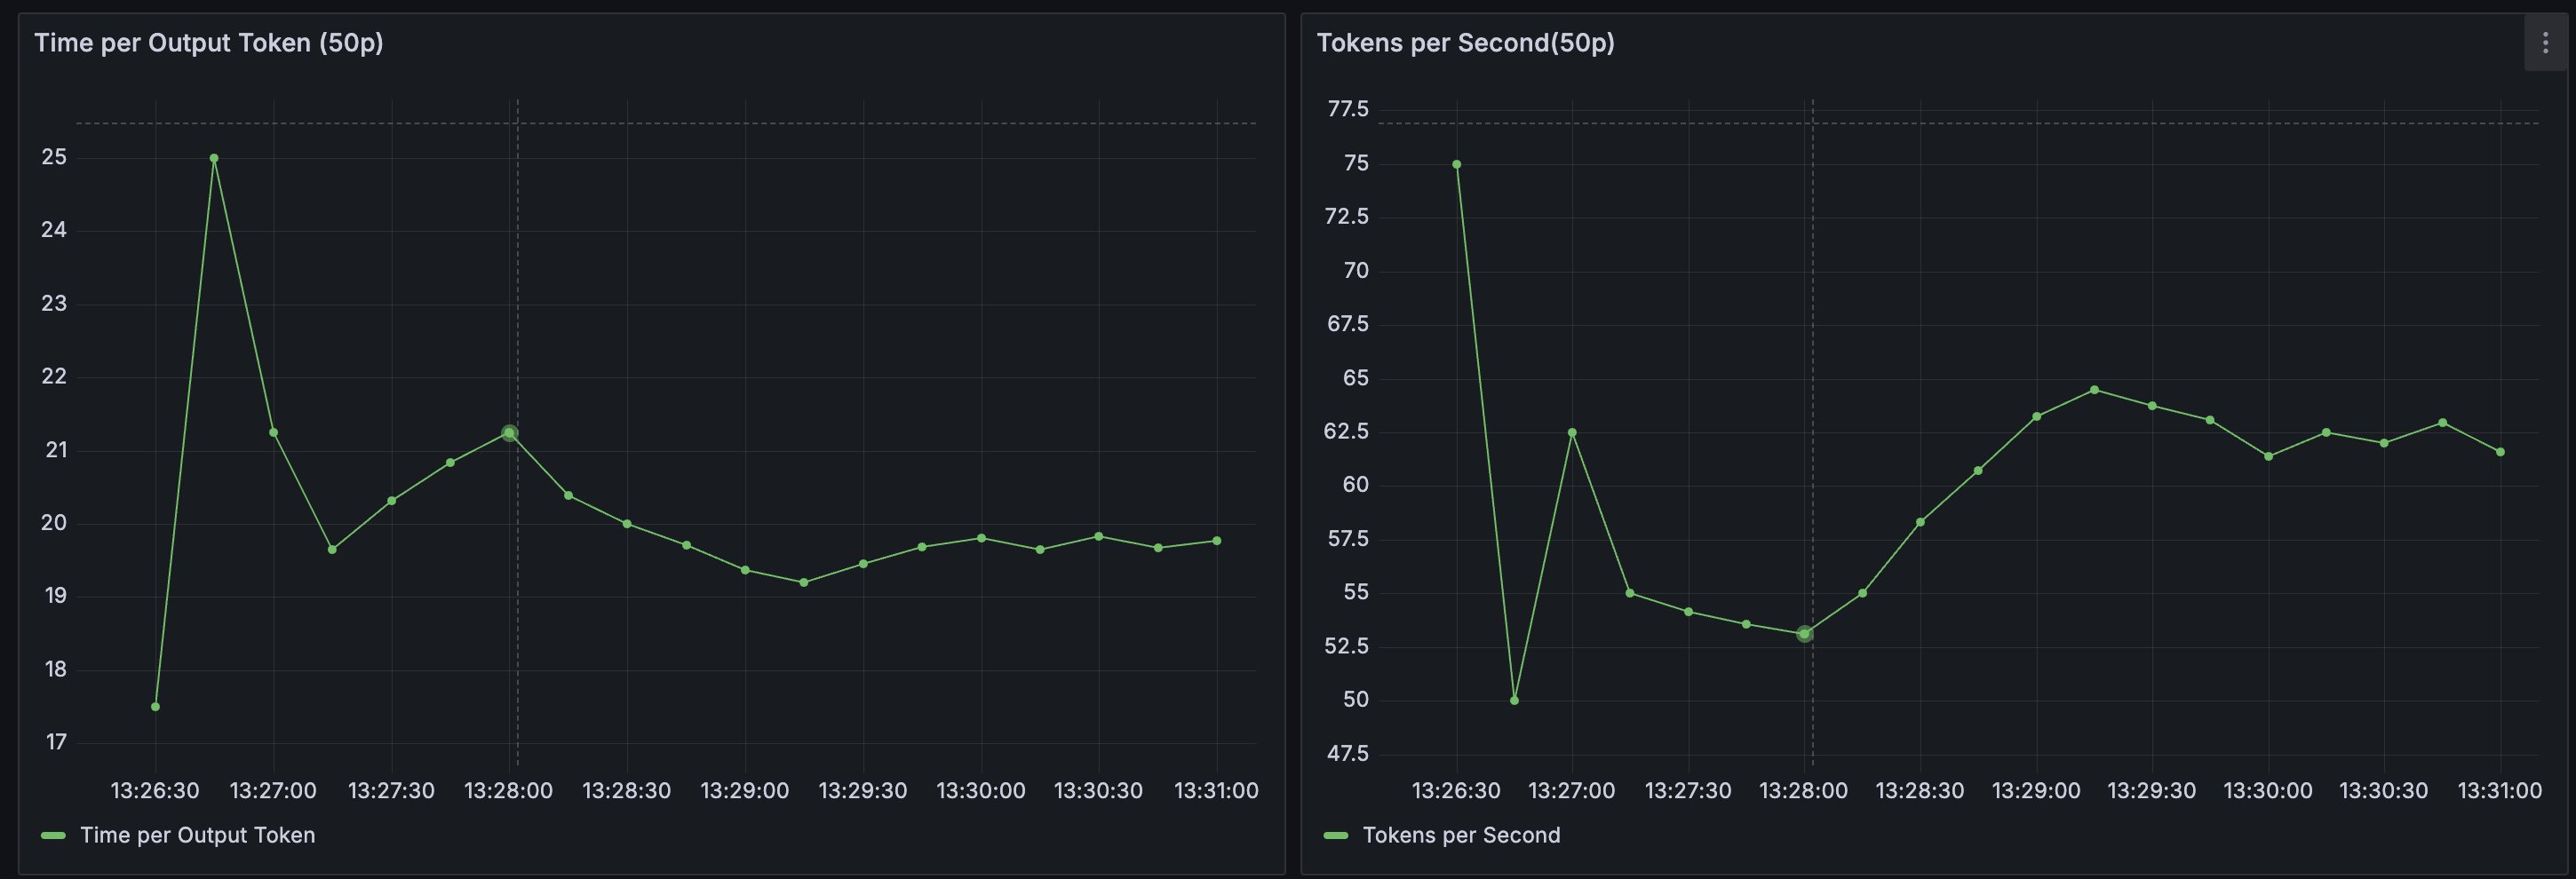
Plano acts a source for several monitoring metrics related to agents and LLMs natively integrated via OpenTelemetry to help you understand three critical aspects of your application: latency, token usage, and error rates by an upstream LLM provider. Latency measures the speed at which your application is responding to users, which includes metrics like time to first token (TFT), time per output token (TOT) metrics, and the total latency as perceived by users. Below are some screenshots how Plano integrates natively with tools like Grafana via Promethus
Metrics Dashboard (via Grafana)
Configure Monitoring
Plano publishes stats endpoint at http://localhost:19901/stats. As noted above, Plano is a source for metrics. To view and manipulate dashbaords, you will need to configiure Promethus (as a metrics store) and Grafana for dashboards. Below are some sample configuration files for both, respectively.
global:
scrape_interval: 15s
scrape_timeout: 10s
evaluation_interval: 15s
alerting:
alertmanagers:
    - static_configs:
        - targets: []
    scheme: http
    timeout: 10s
    api_version: v2
scrape_configs:
- job_name: plano
    honor_timestamps: true
    scrape_interval: 15s
    scrape_timeout: 10s
    metrics_path: /stats
    scheme: http
    static_configs:
    - targets:
        - localhost:19901
    params:
    format: ["prometheus"]
Brightstaff metrics
In addition to Envoy’s stats on :9901, the brightstaff dataplane
process exposes its own Prometheus endpoint on 0.0.0.0:9092 (override
with METRICS_BIND_ADDRESS). It publishes:
HTTP RED —
brightstaff_http_requests_total,brightstaff_http_request_duration_seconds,brightstaff_http_in_flight_requests(labels:handler,method,status_class).LLM upstream —
brightstaff_llm_upstream_requests_total,brightstaff_llm_upstream_duration_seconds,brightstaff_llm_time_to_first_token_seconds,brightstaff_llm_tokens_total(labels:provider,model,error_class,kind).Routing —
brightstaff_router_decisions_total,brightstaff_router_decision_duration_seconds,brightstaff_routing_service_requests_total,brightstaff_session_cache_events_total.Process & build —
process_resident_memory_bytes,process_cpu_seconds_total,brightstaff_build_info.
A self-contained Prometheus + Grafana stack is shipped under
config/grafana/. With Plano already running on the host, bring it up
with one command:
cd config/grafana
docker compose up -d
open http://localhost:3000   # admin / admin (anonymous viewer also enabled)
Grafana auto-loads the Prometheus datasource and the brightstaff
dashboard (look under the Plano folder). Prometheus scrapes the host’s
:9092 and :9901 via host.docker.internal.
Files:
config/grafana/docker-compose.yaml— one-command Prom + Grafana stack with provisioning.config/grafana/prometheus_scrape.yaml— complete Prometheus config withenvoyandbrightstaffscrape jobs (mounted by the compose).config/grafana/brightstaff_dashboard.json— 19-panel dashboard across HTTP RED, LLM upstream, Routing service, and Process & Envoy link rows. Auto-provisioned by the compose; can also be imported by hand via Dashboards → New → Import.config/grafana/provisioning/— Grafana provisioning files for the datasource and dashboard provider.